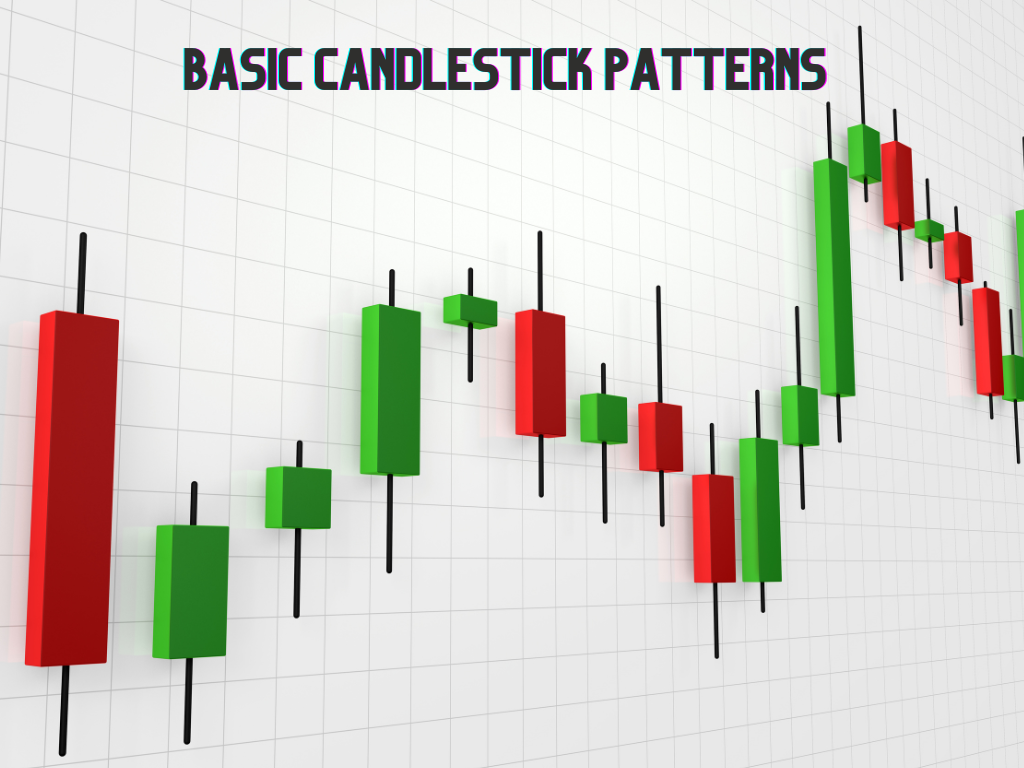
Technical analysis uses various tools to assist traders in determining trends and anticipating setbacks. Aside from technical indicators, the candlestick chart and its patterns are a great way to analyze price action.
Candlestick trading is a type of technical analysis that employs chart patterns. It is a financial chart that displays the price movement of derivative products, equities, and currency markets as patterns.
This blog will teach you about 10 Basic candlestick patterns that will assist you in making better investment decisions.
What is a Candlestick Pattern?
Candlestick patterns are a financial, technical analysis tool that graphically depicts everyday stock price information on a chart.
They are useful in assisting analysts in forecasting future market price movements based on previous price patterns.
They usually represent one full day of price movement, so within a month, there will be up to 20 days of trading with 20 candlestick patterns.
Components
Like a bar chart, a daily candlestick chart displays the stock’s open, high, low, and close prices for the day.
It has a broad section known as the “real body.” It reflects the price range between the day’s opening and closing.
When the real body fills in or becomes black, it indicates that the close was lower than the open.

10 Basic Candlestick Patterns
Here are 10 Basic Candlestick Patterns that you should definitely know before trading.
1. The Hammer Pattern
The hammer pattern is a single candlestick pattern that occurs at the end of a downward trend and indicates a bullish turnaround. This candle’s real body is narrow and located at the top, with a lower shadow that should be more than twice the size of the real body.
The psychology behind this candle formation is that prices opened, and sellers pushed down prices. Suddenly, buyers entered the market, increasing prices and closing the trading session higher than the initial price.

2. The Inverse Hammer Pattern
The inverse hammer pattern resembles another basic candlestick pattern that is the hammer pattern. It differs from the normal hammer in that the upper shadow is much longer, while the lower filament is very short.
The pattern suggests a period of buying pressure, accompanied by a failed attempt by bears to drag the price down. As a result, buyers respond with even more coercion, driving up prices.

3. Head and Shoulder Pattern
The head and shoulder chart pattern is a bear market reversal formation on the candlestick chart that can help traders recognize a trend reversal after it has finished.
While the bullish setup resulted in an opposite head and shoulders pattern. This pattern usually appears at the end of an uptrend and indicates a reversal. Traders regard this basic candlestick pattern as among the most dependable, providing very strong signals.

4. Piercing Pattern
A piercing pattern is a several-candlestick chart pattern that appears after a downwards trend and indicates a bullish reversal. It is formed by two candles, the first of which is a bear market candle indicating the continuation of the downtrend.
The second candle is a bullish candle that starts the gap down but closes more than 50% of the prior candle’s real body, indicating that the bulls have returned to the market and a bullish turnaround is imminent.

5. The Morning Star
The Morning Star is a multiple candlestick chart pattern that appears following a downwards trend and indicates a bullish reversal.
If a bullish candle forms the following day, traders can enter a long position with a halt at the low of the second candle.

6. Three Line Strike Reversal Pattern
The bullish Three Line Strike reversal pattern creates three black candles within a downwards trend. Each bar has a lower drop and closes near the intra-bar low.
The fourth bar begins even lower but reverses in a wide-range outside bar that closes above the series high. The first print also represents the low of the fourth bar.

7. Doji Candlestick
Doji candlesticks is another basic candlestick pattern that has the same opening and closing price, or their bodies are concise. A Doji should have a very small body that would seem like a fine line.
It indicates indecision or a battle for territory between sellers and buyers. During the session, prices move above and below the open price but close at or near the open price.

8. Two Black Gapping Pattern
The bearish Two Black Gapping continuation pattern occurs after a significant top in an uptrend, with a gap down that produces two black bars with lower lows.
This pattern suggests that the decline will continue to lower lows, potentially triggering a larger-scale downtrend.

9. Hanging Man Formation
In the Hanging Man formation, the long handle demonstrates that there was a good-sized pullback. Sellers could take over and reduce the price, resulting in a new steady decline.
In candlestick trading, this is a relatively reliable bearish formation. It resembles a hammer, but it is red and occurs at the peak of an uptrend.

10. Three Black Crows Reversal Pattern
The bearish The Three Black Crows reversal pattern begins at or close to the peak of an upswing and consists of three black bars with lower lows that close near intra-bar lows.
This pattern suggests that the downturn will continue to lower lows, potentially triggering a larger-scale downtrend.

CONCLUSION
To summarize, candlestick trading is technical but simple, which is why it is popular among those who want to understand market sentiment and objectively evaluate stock prices.
The candlestick chart is the most comprehensive style to display the price of an asset. Here, we have listed the top ten Basic candlestick patterns that will undoubtedly benefit you as a trader in the long run.


0 Comments